In recent years, the number of extremely hot summer days has increased, and the number of people suffering from heatstroke indoors is increasing. Concrete, the building material, stores heat, so the temperature inside the building does not drop much even at night. It is important to take measures such as using the air conditioner appropriately indoors.
What should we do about buildings? How effective is it?
We have created a greening calculation program that easily calculates the rooftop surface temperature and the amount of carbon dioxide associated with air conditioning when a roof is greened or a highly reflective paint is applied.
Below is an example of calculation without greening. An example graph with greening is included for comparison.
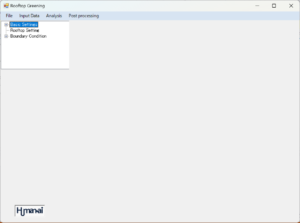
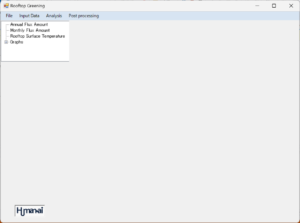
1.When you start the rooftop greening calculation, the following screen will appear.
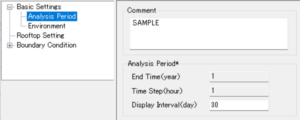
2.Select “Analysis Period” and set the analysis period and time step.
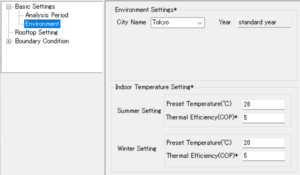
3.Select “Environment” and set the environment.
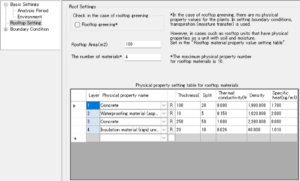
4.Select “Rooftop Settings” and set the roof material.
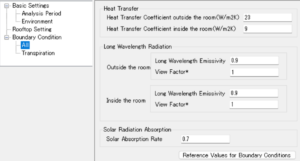
5.Select “Set boundary conditions” and “All”. If you have a rooftop garden, also set ”Transpiration”.
6.Save it with “File” on the menu bar and click “Analysis” to perform the calculation.
When the calculation is completed and you click “Result processing” on the menu bar, the following screen will appear.
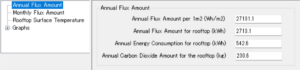
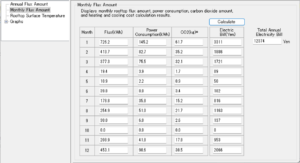
7.Select “Annual Flux Amount” to display the annual flux amount and annual carbon dioxide amount.
8.Select “Monthly Flux Amount” to display the monthly flux amount and monthly carbon dioxide amount.
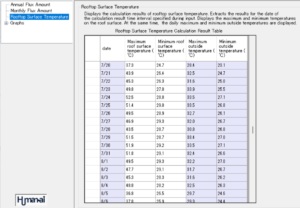
9.Select “Rooftop surface temperature”, the daily maximum and minimum temperatures of the rooftop surface and the maximum and minimum temperatures of the outside air temperature will be displayed.
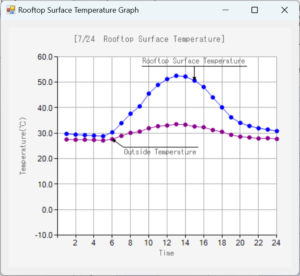
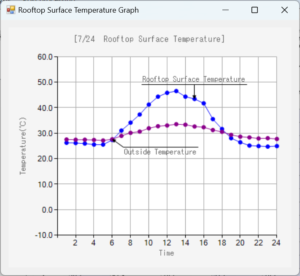
Click on a date, a time history graph of the rooftop surface temperature and outside temperature for that day will be displayed. The graph (no greening) on July 24th is displayed in the figure on the left below. Furthermore, we have calculated the case where rooftop greening was applied under the same conditions, and the graph (greening) on July 24th is also shown on the right below.
| no green | green |
 |
 |
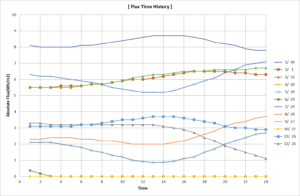
10.Select “Flux Time History” under “Graphs”, excel will start and display a time history diagram of absolute flux flowing from the rooftop surface.
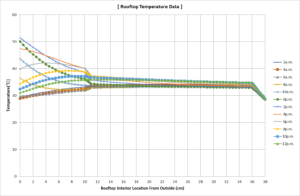
11.Select “Temperature Inside Rooftop” under “Graphs”, excel will start and display a time history chart of the temperature inside the rooftop. Here we are displaying the time history chart for July 29th.